Flywheels and input metrics
Everyone knows the saying that “what gets measured gets managed”. But the choice of what to measure makes all the difference.
The obvious metrics to measure are the ones that describe outcomes: revenue, subscribers, stock price. These are output metrics; easy to choose and important to know.
But terrible at telling you what to do. If your revenue is too low, knowing that doesn’t help you raise it.
The metrics that actually help are upstream. These are input metrics.
They’re harder to define because they’re not in financial statements. You have to think your way to them by working backwards.
The best technique I know to find them is to think in terms of flywheels. These are reinforcing loops where one action leads to another, which leads to another, and eventually circles back to strengthen the first.
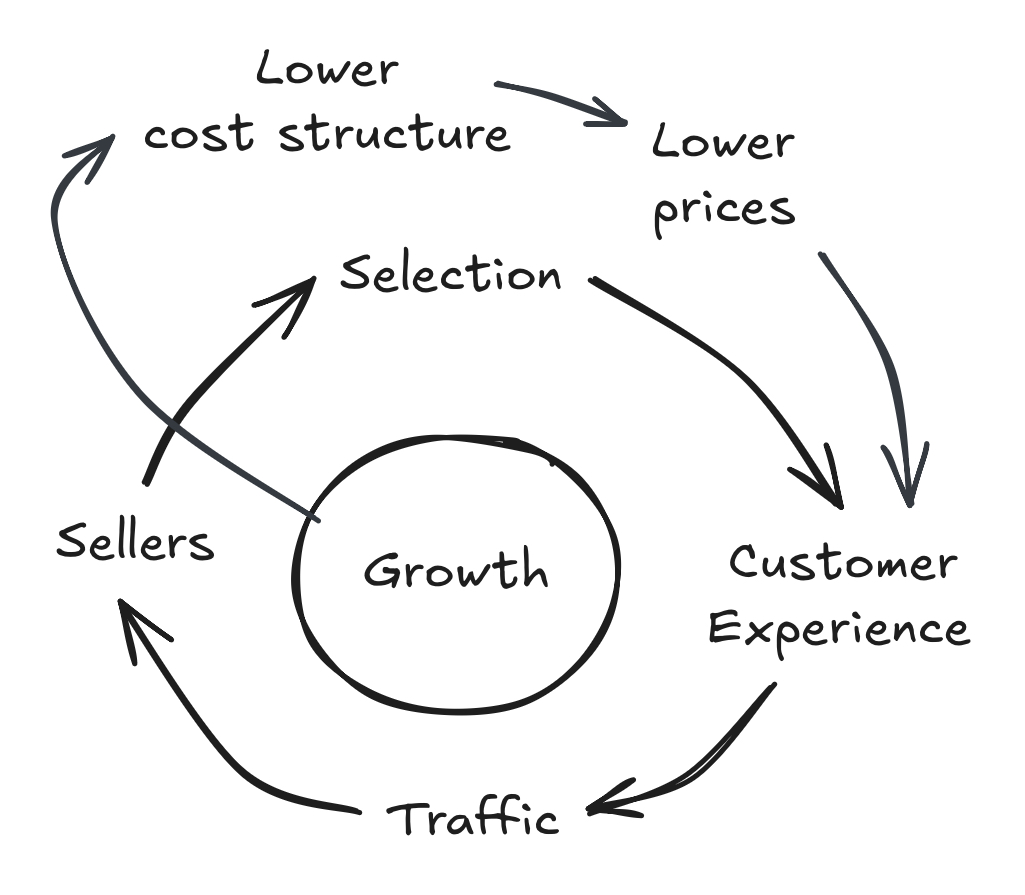
This idea comes from Jim Collins, but the most famous example is probably the napkin sketch Jeff Bezos drew in 2001.
You start with an output metric, like growth, and ask what actually drives it. If you keep asking “what causes that?”, you’ll often uncover a loop, where each element strengthens the next; that’s your flywheel.
Take Amazon’s flywheel. If growth is the aim, we can think through what might be needed. Well, you need customers for sure. To get customers, you need a selection, low prices, and a good customer experience. To get a selection, you need sellers. To get sellers, you need demand. And so the loop forms.
But now we push further. “Customer experience” is still abstract. What actually improves it? Shipping speed is one idea.
Improve shipping speed and customers notice. As more customers buy, sellers follow the demand. More sellers increase selection. Better selection improves customer experience. As volume grows, scale lowers costs, which allows prices to fall, feeding directly back into customer experience and, ultimately, growth.
Shipping speed is now an input metric. Concrete, measurable, and directly actionable. You can take targeted steps to improve it. And you can do this all around the flywheel; each element has its own set of inputs for you to discover.
This isn’t only for product businesses either. Here’s what a flywheel might look like for a consulting firm using revenue growth as the output metric.
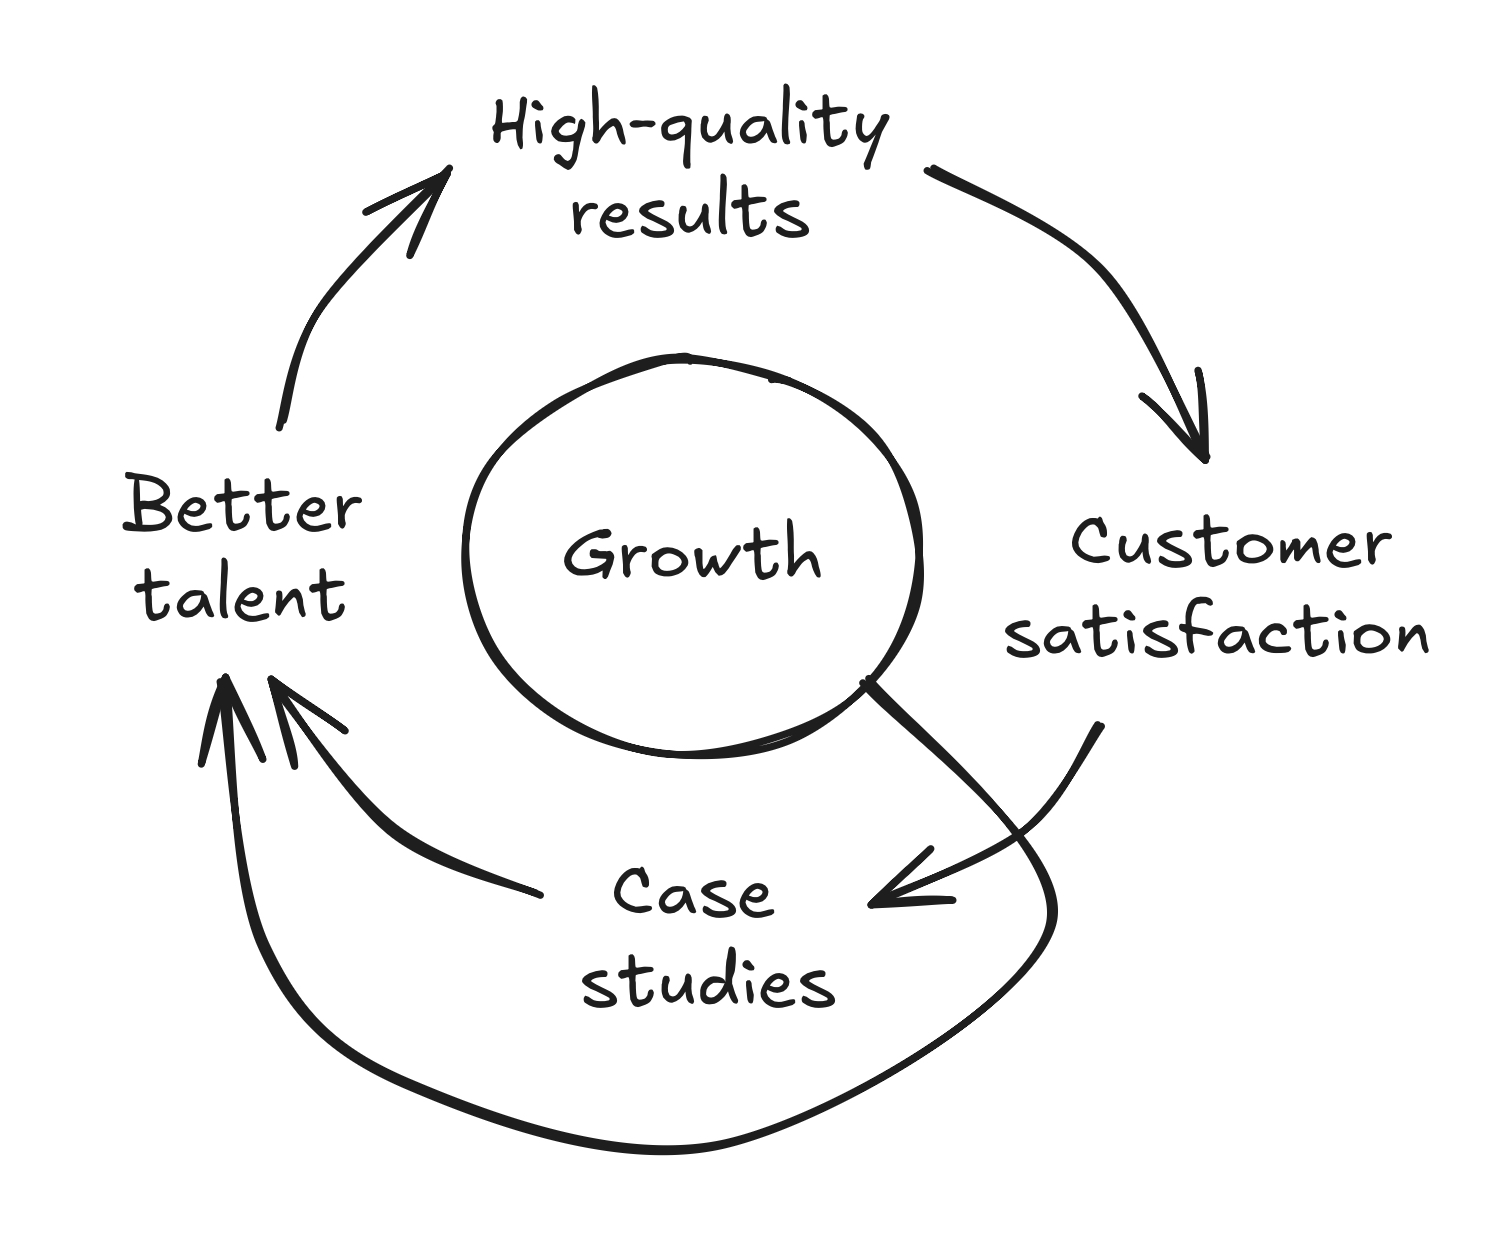
Better talent produces better work. Better work makes clients happier. Happy clients generate referrals and case studies. That attracts better talent and more clients. Higher revenue allows further investment in talent, accelerating the loop.
You can intervene anywhere in that cycle.
Suppose you focus on “better work.” You can break that down into input metrics you can influence: the percentage of engagements with clear & measurable success criteria defined upfront; how quickly blockers get cleared once identified. Neither will be found on the balance sheet, but improving them speeds up the flywheel.
Defining input metrics is hard. It takes experience. It’s iterative. You learn what matters by testing and adjusting, and what you think matters at the start usually isn’t quite right. But if you can conjure the right ones and get people focused on them, the outputs will take care of themselves.
References / related reading
Working Backwards, Colin Bryar & Bill Carr
Good to Great, Jim Collins